Transportation Affordability
Strategies To Increase Transportation Affordability
~~~~~~~~~~~~~~
Victoria Transport Policy Institute
~~~~~~~~~~~~~~~~~~~~
Updated 23 March 2016
This chapter describes the concept of “transportation affordability,” its importance to society, how to evaluate it for transport planning, and practical ways to improve it. For more information see Transportation Affordability: Evaluation and Improvement Strategies at www.vtpi.org/affordability.pdf
Transportation Affordability
Affordability refers to people’s ability to purchase basic goods and services. It can be defined as the situation in which household incomes can purchase Basic Goods (housing, food, medical care and transport), or simply that lower-income people need not worry too much about purchasing essential goods and services. Since affordability refers to household’s ability to save money, it is particularly evident in the expenditure patterns of lower-income household, and their response to financial shocks such as reduced income or new cost burdens; for example, public transit services tend to provide affordability because they provide a fallback option to lower-income commuters when their vehicles are unavailable.
Transportation affordability means that people can purchase access to basic goods and activities (medical care, basic shopping, education, work and socializing), which typically means that households spend less than 20% of budgets on transport and less than 45% on transport and housing combined. This is a critical Equity objective, since it affects the cost burdens and opportunities available to disadvantaged people.
Transportation Affordability can be evaluated from several perspectives. It is affected by the number of vehicles that a household must own, the costs of owning and driving each vehicle, indirect costs such as residential parking, and the quality and costs of alternative modes such as Transit, Ridesharing, Cycling, Walking, Carsharing and Taxi services. Lower-income households tend to be particularly impacted by the costs of alternative modes, since they rely on them more than households with higher incomes.
Individual and community factors influence transportation affordability. People who must commute to work or school have greater transportation requirements than people who do not work or work at home. People with physical disabilities or other special needs tend to require more expensive transportation services.
Many planning decisions affect transportation affordability. Modern transport planning responds well to demands of wealthy travelers but not to the needs of the poor. Current planning supports automobile, air and freight transport but does much less to improve affordable modes such as walking, cycling and public transit travel, or to insure that affordable housing is available in accessible locations. This unfair and exacerbates economic problems since many workers find it difficult to access education and employment, and because motorized modes require costly infrastructure, impose external costs, and are resource-intensive, leading to increasing dependence on imported oil.
Affordability should be evaluated with regard to total rather than unit costs. For example, low per-gallon fuel prices provide less affordability in an automobile-dependent community where high vehicle ownership and mileage is necessary for access than high fuel prices with a more Diverse Transportation system and a more Accessible land use pattern.
In general, Automobile Dependency tends to increase per capita transportation costs and reduce overall transportation affordability, while Smart Growth can increase transportation affordability by creating more Accessible Land Use (which reduces the amount of travel needed for Basic Access) and improving affordable Transportation Options such as public transit, ridesharing, cycling and walking. Smart Growth and TDM programs can help increase the Prestige of affordable modes such as walking, cycling and transit, making it more socially acceptable for residents to use them. As a result, greater portion of household wealth is devoted to mobility in Automobile Dependent communities than in communities with more balanced transportation systems.
McCann (2000) found that households in sprawled regions devote more than 20% of their expenditures to surface transportation (more than $8,500 annually), while those in communities with more efficient land use spend less than 17% (less than $5,500 annually), representing savings of hundreds of dollars a year. Similarly, lower-income households that rely on automobile transportation tend to spend a relatively large portion of their income on basic transportation, while those that use other travel modes spend much less (STPP 2003; Bernstein, Makarewicz and McCarty 2005). Lower-income households in suburban locations tend to be particularly vulnerable to high transportation costs (Dodson and Sipe 2006). The same pattern tends to occur in Developing Countries: Isalou, Litman and Shahmoradi (2014) found that in the city of Qom, Iran, suburban-area households spend over 57% of their monthly income on housing and transport, significantly more than the 45% spent by households in the central district.
Transportation cost savings of Smart Growth may be offset, at least in part, by higher housing costs, unless special efforts are made to address housing affordability objectives (Arigoni 2001; CTOD and CNT 2006; Pollack, Bluestone and Billingham 2010), for example by offering Location Efficient Mortgages and Parking Management (Litman, 2003). This pattern is also reflected in time series data. Transportation increased significantly as a portion of typical household expenditures during the last century, from 3.1% in 1918, to 15.1% in 1961, and up to 25.7% in 1987 (Johnson, Rogers and Tan 2001).
Fan and Huang (2011) developed a contextualized transportation affordability analysis framework that accounts for the different travel demands and abilities of different demographic and geographic groups. Lipman (2006) found that in 17 of 28 Metropolitan areas studied, the average transportation expenses for working families with annual incomes between $20,000 and $50,000 are actually higher than their housing costs. Overall, across all 28 Metro areas, working families spend an average of 28%, or $9,700, of their incomes on housing and nearly 30%, or $10,400, on transportation. Transportation costs are based on auto ownership, auto use and public transit use and take into account the cost of commuting, as well as traveling for school, errands and other daily routines. While the share of income working families devote to housing and transportation differed between Metro areas, the combined burden of the two expenses was remarkably similar. These combined costs range from a low of 54% in Pittsburgh to a high of 63% in San Francisco, with 25 of the 28 Metro areas within three percentage points of the average combined burden of 57%. Among all American households and income levels, and not just working families, housing and transportation are also the two largest expenses, but consume a smaller share of income at a total of 48%.
Transportation cost savings are equivalent to increased household income. For example, in an automobile dependent community, a household with two employed adults needs to own two automobiles, costing approximately $10,000 a year, but in a community with a more diverse transportation system, the same household may only need one car, plus $1,000 in transit and taxi fares, saving $4,000 annually. This is equivalent to more than $5,000 in additional pre-tax income. Many households can afford the higher costs of automobile dependency, but some households find these expenses a financial burden and value opportunities to reduce their transportation costs.
A detailed study comparing housing and transportation costs in a typical urban area found that although average household expenditures on housing are similar in different geographic locations, transportation expenditures are higher in outer suburbs and exurban areas than in inner suburbs and cities (CTOD and CNT 2006; Lipman 2006), as illustrated in Figure 1. According to this study, transportation costs average 19% of household expenditures overall, but range from about 10% in multi-modal communities up to about 25% in automobile dependent communities. To the degree that Smart Growth reduces household transportation costs it can increase overall affordability and offsets any increased housing costs, which can be considered comparable to additional household income. Transit Oriented Development can increase overall household affordability by reducing transportation costs and increasing income and racial diversity in accessible neighborhoods (CTOD 2006).
Figure 1 Share of Income Spent on Housing and Transport (Lipman 2006)
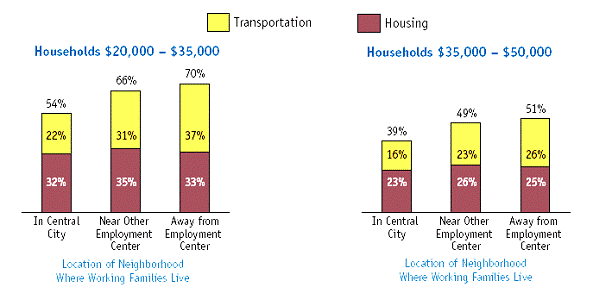
The portion of income devoted to housing and transportation combined by lower and moderate income households increases with distance from major employment centers (those with at least 50,000 employees). Reduced housing costs are more than offset by increased transportation costs, reducing overall affordability.
The Self-Sufficiency Standard (http://selfsufficiencystandard.org/standard.html) established by the Center for Women’s Welfare defines the net income required to meet basic needs without public subsidies (e.g., public housing, food stamps, Medicaid, etc.) or private/informal assistance (e.g., free babysitting by a relative or friend, food banks or food stamps, shared housing, etc.). These costs vary by geographic and demographic factors. It assumes that all adults (whether married or single) work full-time, and so includes commuting and child care expenses, and the net effect of federal, state and local taxes and tax credits. This Standard is calculated for seventy different family types, with one or two adults, and zero to three children of various ages. To the extent feasible the data used in the Self-Sufficiency Standard are:
- Collected or calculated using standardized or equivalent methodology nationwide.
- Obtained from scholarly or credible sources such as the U.S. Census Bureau.
- Set at minimum but adequate levels; (e.g., nutrition levels).
- Updated annually and varied geographically and/or by age as appropriate.
Housing costs are based on the most recent Fair Market Rents (FMRs) calculated annually by the U.S. Department of Housing and Urban Development (HUD) for each state’s metropolitan and non-metropolitan areas. FMRs reflect the cost of housing that meets basic standards of decency, including utility costs (except telephone and cable). In most cases, FMRs are set at the 40th percentile, meaning that 40% of the housing in a given area is less expensive than the FMR.
Transportation costs vary by location. If public transportation service is considered adequate in the area, indicated by 7% or greater transit commute mode share, transportation costs are calculated based on the price of a monthly adult pass. If the area lacks adequate public transportation, transportation costs are calculated based on the average cost of owning and operating a car for each employed adult. Vehicle ownership costs are based on Consumer Expenditure Survey amounts for households between the 20th and 40th percentile incomes.
As a general reference, transportation costs can be considered unaffordable if they exceed 20% of a household’s income, which is slightly higher than the national average (excluding expenditures on luxury travel, such as long-distance vacation trips). For a wealthy household earning $100,000 annually, this allows a generous $20,000 to be spent annually on transportation, but for a low-income household earning $20,000, this leaves just $4,000.
On average, low-income motorists spend an excessive portion of their income on transportation, as illustrated in Figure 2. Households in the lowest two income categories devote about a third of total income to transportation, mainly automobiles. This declines to 18.2% for average households with $41,532 in after tax income, and just 13% for the highest income households, those that earn more than $70,000 annually. This indicates that transportation costs are regressive with respect to income. This high cost burden is particularly significant in automobile dependent areas during periods when real (inflation adjusted) fuel costs increase rapidly.
Figure 2 Portion of Household Income Spent on Transport (BLS 2000)

Transportation expenditures are highest as a portion of income for lower-income households, indicating that automobile dependency is a financial burden to the poor.
The portion of household income devoted to transportation tends to be particularly high for lower income households that own an automobile and low for households that do not own an automobile. These factors are generally overlooked because most statistics aggregate the two groups together, essentially hiding the excessive cost burden of vehicle ownership on poor households.
Although it is possible to purchase an automobile for just a few hundred dollars, such vehicles tend to be unreliable, with high maintenance and repair cost. As a result, most lower-income motorists constantly face the risk of unaffordable vehicle repair and replacement costs. Vehicle insurance also tends to be a significant financial strain on low-income motorists (Litman 2004a). Many lower-income motorists are in higher-risk insurance categories due to age, experience and territory rating factors, and so must pay hundreds of dollars for basic coverage. As a result, they face the choice of devoting an excessive portion of their income to vehicle insurance, driving uninsured (which is illegal in many jurisdictions), or foregoing automobile ownership.
On the other hand, a low- or moderate-income household can easily and affordably satisfy their Basic Access needs by using a combination of walking, cycling, ridesharing, transit services and occasional vehicle rentals. TDM strategies that improve these options, and help create multi-modal communities, can significantly increase transportation affordability.
Transportation Affordability – by Todd LitmanIt is simple human nature that people are most concerned with the problems they personally face, problems they fear, and problems they hear about from family members and friends, than they are concerned about more distant problems.
Transportation decision-makers tend to be most concerned about the problems facing motorists, and less concerned about problems facing non-drivers. After all, transportation professionals and public officials are mostly physically-able, middle-class professionals with demanding jobs and active lifestyles. With few exceptions, they, their colleagues and friends are the type of people who rely heavily on automobile travel and seldom face serious financial constraints, such as being forced to choose between paying transportation expenses and essentials such as utilities or food.
As a result, transportation decisions-makers tend to assume that transportation affordability means keeping the cost of driving low. They are less likely to value cost savings opportunities that depend on reduced driving.
For example, a few years ago I was working with a group of professionals evaluating the potential benefits of Pay-As-You-Drive vehicle insurance. One of these benefits is that it increases automobile affordability: rather than paying a large fixed insurance premium, motorists have the opportunity to save money if they reduce their annual vehicle mileage. One team member was skeptical. He could not believe that insurance costs are a major financial burden, or that motorists could significantly reduce their mileage to capture savings. He argued that insurance companies were already improving affordability by offering more convenient premium payment plans. But another team member pointed out, “My secretary, a single parent, sometimes can’t afford to pay her vehicle insurance premiums, and so she gives up driving for a several weeks and relies on public transportation, until she saves a few hundred dollars.”
Of course, completely giving up a car for a few weeks is difficult, because it cannot be used even for high-value trips. Consumers are generally much better off with a price structure that allows them to drive when they need to, but with plenty of opportunities to save money by reducing their driving and using lower-cost modes.
The most affordable transportation system is one that gives consumers lots of Transportation Options, including walking, cycling, public transit, taxi service, and ways to use a car with minimal fixed costs (PAYD and Carsharing). This allows people to choose the best travel option for each trip. |
Improving Affordable Modes
These strategies increase transportation affordability by improving the quality of lower-cost transportation modes.
Nonmotorized Transportation Planning
Nonmotorized transportation (walking, cycling, handcarts, etc.) are affordable forms of transportation by themselves, and as access modes to transit. There are many ways to improve Pedestrian and Cycling transportation.
Ridesharing
Informal ridesharing is a particularly important option for non-drivers and lower-income residents.
School Trip Management
This can help improve transportation options for students and parents, which can be particularly beneficial to lower-income households. Such programs can provide a variety of services, including transit, ridesharing and nonmotorized transportation improvements.
Telework
Telecommunications can often substitute for physical travel. Telework programs can help people obtain Internet connections and skills, particularly those who are lower-income.
Taxi Service Improvements
Taxi service is an important transportation option in many situations. Establishing formal taxi service can improve transportation options in many rural communities.
Transit Improvements
Transit and Shuttle Services provide affordable transportation. Lower-income people tend to rely heavily on transit (Litman, 2004b). Shifting travel from automobile to transit can provide Vehicle Cost savings, and may allow a household to reduce vehicle ownership, providing thousands of dollars in annual savings.
Bike/Transit Integration
Bicycling integrates well with Public Transit (bus, train, ferry, and air transport). Transit is most effective for moderate- and long-distance trips on busy corridors, while cycling is effective for shorter-distance trips with multiple stops. Combining transit and cycling can provide a high level of affordable mobility.
Increase the Affordability of Transport Services
These strategies increase transportation affordability by reducing the financial costs of transport services.
Commuter Financial Incentives
Commuter Financial Incentives such as Parking Cash Out and Transit Benefits provide financial rewards to people who use alternative commute modes, as an alternative to parking subsidies. This allows commuters to choose the most affordable mode, and tends to provide financial benefits to lower-income workers, who tend to use alternative modes more than average.
Commute Trip Reduction Programs
Commute Trip Reduction (CTR) (also called Employee Trip Reduction or Vehicle Trip Reduction) programs give commuters resources and incentives to reduce their automobile trips. Such programs can provide services that improve commuter affordability, including Rideshare Matching, Guaranteed Ride Home, Alternative Scheduling, Telework and Walking and Cycling Improvements.
Transit and Rideshare Subsidies
Subsidies that reduce transit and vanpool fares increase transportation affordability.
Location Efficient Development
Location Efficient Development consists of residential and commercial development located and designed to maximize Accessibility. This improves affordable transportation options, such as walking, cycling and transit, and tends to significantly reduce household transportation costs. If implemented with Parking Management, it can increase housing affordability by reducing parking costs.
Improve Accessibility
These strategies improve transportation affordability by improving land use accessibility, which reduces the amount of physical travel needed to reach goods and activities.
Smart Growth
Smart Growth includes a variety of land use management strategies that can reduce Automobile Dependency by increasing Transportation Options and Accessibility. This can provide significant consumer savings (James Taylor Chair, 2000). Specific Smart Growth land use management strategies include:
· Location Efficient Development
· Transit Oriented Development
Address Security Concerns
Many lower income people would like to live in more accessible neighborhoods or use alternative transportation modes, but they feel unsafe doing so. Programs that Address Security Concerns of walkers, cyclists and transit users, and improve safety in urban neighborhoods, can help increase transportation affordability.
Make Automobile Use More Affordable
These strategies improve transportation affordability by reducing the cost of using an automobile.
Carsharing
Carsharing refers to automobile rental services intended to substitute for private vehicle ownership. It makes occasional use of a vehicle affordable, even for low-income households.
Pay-As-You-Drive Pricing
Pay-As-You-Drive vehicle insurance and registration fees convert these into variable costs: the less you drive the less you pay. This makes vehicle ownership more affordable, provided that motorists limit their driving (Litman 2004a).
Affordability Impacts of Other TDM Strategies
Other affordability impacts of TDM are discussed below.
Some TDM strategies can reduce transportation affordability for some users while increasing it for others. In particular, Parking, Road and Vehicle pricing strategies may increase the cost of driving, at least under certain circumstances, and therefore reduce transportation affordability for some users, while providing savings for other types of consumers. The overall affordability impacts depend on several factors, including how groups are defied, the quality of transportation options available, and how revenues are used (Pricing Evaluation). If additional revenues are used, in part, to reduce other taxes or improve affordable transportation options (such as improving transit services), they are likely to provide economic benefits overall to lower-income households.
In general, affordability increases overall if consumers pay directly rather than indirectly for expenses such as roads and parking facilities, because direct payment allows consumers a new opportunity to save money by reducing their vehicle ownership and use. For example, if parking is bundled with housing costs, consumers must pay regardless of whether or not they own a vehicle. Charging directly for parking provides savings to households that own fewer than average vehicles, and allows a household the option of saving money by reducing their vehicle ownership. Similarly, Congestion Pricing allows consumers to save money if they use alternative modes, routes or travel times to avoid driving on congested roads. Overall affordability tends to increase with Transportation Diversity, which gives travelers affordable alternatives so they can reduce their vehicle use.
Housing Affordability
Some TDM strategies, particularly Smart Growth, have been criticized for reducing housing affordability (QuantEcon 2002). Critics argue that urban growth boundaries and other regulations limiting urban fringe housing development in growing urban regions reduce the supply of land available for new construction, raising housing costs by thousands of dollars per unit. However, the ability to expand outward is just one factor affecting housing supply and affordability; other factors include the ability to infill and increase density, which are affected by traditional regulations such minimum parking requirements and building setbacks. For example, requiring two parking spaces per housing unit increases urban housing development costs by $10,000 to $30,000 per unit compared with requiring one space, or with unbundling parking from housing costs (i.e., renting parking spaces separately from housing units), and regulations requiring setbacks, restricting density and prohibiting secondary suites can have similar economic impacts (Location Efficient Development). The evidence concerning the effects of growth management regulations indicates that when other factors are considered, Smart Growth does not reduce housing affordability (Nelson, et al., 2002; Wassmer and Baass, 2005; Tomalty and Haider 2008).
A study by Miller, et al. (2004) used census consumer expenditure data and transportation survey information to compare housing and transportation costs for residents of various locations in the Toronto region. They found that suburban location tends to cost more overall than city locations. In 1996, (the latest year for which complete comparable data is available) the study estimates that a family with one car living 50 kilometres outside downtown Toronto, spent $1,600 more a year on travel. For households with two vehicles — the norm for most suburban families — the annual cost rises to about $5,800 more. The same house in the suburbs would cost about $1,100 a year more in mortgage, property taxes, utilities and maintenance to run than a similarly valued home downtown.
“It is generally believed that many households choose to live in suburban locations either because housing costs are lower there or because households can obtain ‘more house’ for a given expenditure,” says study author Eric Miller. “But housing costs and travel costs tend to increase as one moves away from the central areas of the region’s cities, particularly from (downtown) Toronto. The idea that city living is too expensive just does not seem to hold up,” the study concludes.
A number of specific Smart Growth and TDM strategies can help increase housing affordability (Arigoni 2001; CNU 2008; Tomalty and Haider 2008). These include:
- Intensification: increase the supply of housing in locations that reduce housing and transportation costs, such as Transit-Oriented Development, brownfields, and commercial corridors.
- Housing Form: measures to increase the supply of more affordable housing types, such as smaller lots and homes, rental accommodation, secondary suites, mobile homes and modular houses.
- Development Process: measures to reduce the cost of housing generally – e.g., transportation planning standards, alternative engineering standards, parking standards, improving the approvals process, and addressing NIMBY.
- Parking Management: that reduces parking requirements.
- Location Efficient Development: allow reduced parking requirements and more attractive mortgages for housing in accessible, multi-modal communities.
- Smart Growth Fiscal Reforms: reduce development and utility costs for infill development.
|
True Housing Affordability – by Jim Lazar An “affordable” home is one that:
1. Is located close to transit, shopping, schools and employment, so households can reduce the number of vehicles they must own (for example, owning one rather than two cars), and the miles they must drive. This can save $2,000 - $5,000 per year in vehicle ownership and operating costs.
2. Is energy efficient. This can save $500 - $1,000 per year.
3. Is built with quality materials. This can reduce annual maintenance and replacement costs.
4. Is built with non-toxic materials. This helps prevent respiratory illnesses, saving 2-10 sick days annually. The economic value of good health is extremely high, if difficult to measure.
5. Supports community cohesion (designed to encourage friendly neighborly interactions). This tends to increase security, reduce expenses such as childcare, and improve residents’ quality of life.
It’s the sum of the mortgage payments, the maintenance costs, the transportation costs, health care costs and child care costs that determines affordability, not just the seller’s asking price for a home. |
Related Chapters
For information on user costs see Driving Costs and Transportation Costs. For discussion of the context of Transportation Affordability see Equity Evaluation, Transportation Options, and Basic Access. For discussion of how geographic factors affect transportation costs see Land Use Evaluation and TDM in Developing Regions.
|
A gentleman invited some friends over for a dinner party. Late in the evening he decided to open a very old bottle from the depths of his wine cellar. When he popped the cork, out came a Genie rather than wine. “For releasing me from that bottle, I will give you a choice of gifts. You can either choose great wisdom or a handful of gold coins,” the Genie offered. The gentleman thought for a moment. Not wanting to appear greedy he said, “I choose wisdom over wealth.” The Genie touched him on the forehead which produced a blinding light, and then disappeared in a puff of smoke. The friends all stared at their friend. After a period of silence, one inquired respectfully, “Now that you have great wisdom, what can you share with the rest of us?” The gentleman looked at his friends and replied thoughtfully, “I should have taken the money.” |
Examples and Case Studies
Transportation Affordability Evaluation Framework (Fan and Huang 2011)
This research project developed a contextualized transportation affordability analysis framework that accounts for the different demands and abilities of various demographic and geographic groups. The utility of such a context-sensitive framework is demonstrated via a case study of the Twin Cities metropolitan area, which discusses the quality of access in different geographic areas and measures the transportation financial and time costs of various demographic groups. This analysis indicates that socio-economically disadvantaged groups, such as lower-income working parents, have the lowest auto ownership rate, yet their mobility needs are best served by automobiles, particularly in auto-oriented locations, which require more travel for access to destinations, which leads to higher transportation costs. The researchers conclude that improving transportation affordability and social welfare requires a combination of reduced automobile dependence and financial subsidies for car access among disadvantaged populations.
Curing your Clown-Like Car Habit
Mr. Money Mustache (www.mrmoneymustache.com) is a columnist who writes about practical strategies for affordable living, with particular emphasis on reducing automobile ownership and use.
Housing Affordability Toolbox, (www.co.tompkins.ny.us/planning/vct/3.html)
An online toolkit, Vital Communities Toolbox, created by Tompkins County, New York, catalogues various planning tools that are available to help create and preserve affordable housing. These strategies are based on a set of principles, including "promoting choice and affordability in housing options," and have been adopted by the county as part of its Vital Communities Initiative.
Tools listed on the website are categorized according to how they are applied in practice. For example, strategies such as cluster development, traditional neighborhood design, and infill development are listed as applicable to promoting a mix of housing choices. Other tools, such as inclusionary zoning, streamlined permitting, adaptive reuse, and cottage housing, are grouped together based on their capacity to increase affordable housing options for low- and moderate-income families. The online toolkit also includes a glossary and short description of each tool. Although Tompkins County developed the toolbox to encourage sustainable growth patterns within the county, these strategies can easily be tailored to meet the needs of any community.
Transportation Cost Impacts on Household Affordability (Agrawal, et al. 2011)
This study used in-depth interviews to examine how transportation financial stresses such as reduced income and higher fuel prices affect low-income families. It investigated four general areas of interest: travel behavior and transportation spending patterns; the costs and benefits of alternative modes of travel; cost management strategies; and opinions about the effects of changing transportation prices on travel behavior. Key findings include:
1. Most low-income households are concerned about their transportation costs.
2. Low-income individuals manage their household resources to survive on limited means and to respond to changes in income or transportation costs.
3. In making mode-choice decisions, low-income travelers, like higher-income travelers, carefully evaluate the costs of travel (time and out-of-pocket expenses) against the benefits of alternative modes available to them.
4. Some low-income individuals were willing to accept higher transport expenditures—such as the costs of auto ownership or congestion tolls—if they believed that they currently benefit or would potentially benefit from the increased expenses.
5. Although low-income households find ways to cover their transportation expenditures, many of these strategies have negative effects on their lifestyles.
The report concludes with recommendations for increasing transportation affordability, minimizing the impact of new transportation taxes or fees on low-income people, and developing new research and data collection strategies.
Green Trip Program (http://transformca.org/GreenTRIP)
GreenTRIP is the Traffic Reduction + Innovative Parking certification program for new residential and mixed use developments. GreenTRIP certification rewards projects that apply strategies to reduce traffic and greenhouse gas emissions. GreenTRIP expands the definition of green building to include robust transportation standards for how people get to and from green buildings. TransForm uses tailored traffic reduction programs that apply the most appropriate strategies to help make projects more financially feasible.
References And Resources For More Information
AARP (2008), Opportunities for Creating Livable Communities, Research Report, American Association for Retired Persons Public Policy Institute (www.aarp.org/ppi); at www.aarp.org/research/housing-mobility/indliving/inb155_communities.html.
AARP Livable Communities (www.aarp.org/ppi/issues/livable-communities) website provides guidance on policies and planning practices to create safe, accessible, affordable and vibrant communities suitable for people of all ages and abilities.
Abogo (http://abogo.cnt.org), named after a combination of “abode” and “go,” is a free Internet mapping tool that indicates the transportation affordability and sustainability of specific neighborhoods.
Affordable Housing Design Advisor Website (www.designadvisor.org), sponsored by the U.S. Department of Housing and Urban Development, provides information on developing more affordable housing, redeveloping urban communities and implementing Smart Growth.
Affordable Housing Resource Center (www.novoco.com/resource.shtml).
Asha Weinstein Agrawal, et al. (2011), Getting Around When You’re Just Getting By: The Travel Behavior and Transportation Expenditures of Low-Income Adults, Report 10-02, Mineta Transportation Institute (www.transweb.sjsu.edu); at www.transweb.sjsu.edu/MTIportal/research/publications/documents/2806_10-02.pdf.
Danielle Arigoni (2001), Affordable Housing and Smart Growth: Making the Connections, Subgroup on Affordable Housing, Smart Growth Network (www.smartgrowth.org) and National Neighborhood Coalition (www.neighborhoodcoalition.org); at www.smartgrowth.org/pdf/epa_ah-sg.pdf.
Scott Bernstein, Carrie Makarewicz, Kara Heffernan, Albert Benedict and Ben Helphand (2004), Increasing Affordability Through Reducing the Transportation and Infrastructure Cost Burdens of Housing, Atlanta Neighborhood Development Partnerships (www.andpi.org); at www.andpi.org/uploadedFiles/pdf/03MICI%20MTC%20Report_CNT.pdf.
Scott Bernstein, Carrie Makarewicz and Kevin McCarty (2005), Driven to Spend: Pumping Dollars Out Of Our Households And Communities, STPP (www.transact.org).
Brookings Institute (2005), The Price is Wrong: Getting the Market Right For Working Families in Philadelphia, Metropolitan Policy Program, Brookings Institute (www.brookings.edu).
BLS (annual reports), Consumer Expenditure Survey, Bureau of Labor Statistics (www.bls.gov).
BTS (1997), Mobility and Access; Transportation Statistics Annual Report 1997, Bureau of Transportation Statistics (Washington DC; www.bts.gov), pp. 173-192.
Edward Carman, Berry Bluestone and Eleanor White (2003), Building on our Heritage: A Housing Strategy for Smart Growth and Economic Development, Center for Urban and Regional Policy, Northwestern University (www.curp.neu.edu), for the Commonwealth Housing Task Force.
Center of Excellence for Sustainable Development (www.sustainable.doe.gov) is a US Department of Energy program that supports more resource efficient development.
CNT (2006), Paved Over: Surface Parking Lots or Opportunities for Tax-Generating, Sustainable Development?, Center for Neighborhood Technology (www.cnt.org/repository/PavedOver-Final.pdf).
CNT (2008), Housing + Transportation Affordability Index, Center for Neighborhood Technology (http://htaindex.cnt.org).
CNU (2008), Parking Requirements and Affordable Housing, Congress for the New Urbanism (www.cnu.org); at www.cnu.org/node/2241.
CTOD and CNT (2006), The Affordability Index: A New Tool for Measuring the True Affordability of a Housing Choice, Center for Transit-Oriented Development and the Center for Neighborhood Technology, Brookings Institute (www.brookings.edu); at www.brookings.edu/metro/umi/20060127_affindex.pdf.
CTOD (2006), Preserving and Promoting Diverse Transit-Oriented Neighborhoods, Center for Transit-Oriented Development, funded by the Ford Foundation (www.reconnectingamerica.org); at www.cnt.org/repository/diverseTOD_FullReport.pdf.
CTOD (2009), Mixed-Income Housing Near Transit: Increasing Affordability With Location Efficiency, Center for Transit-Oriented Development and Reconnecting
America (www.reconnectingamerica.org); at www.reconnectingamerica.org/public/display_asset/091030ra201mixedhousefinal.
CTOD (2009), Mixed-Income Housing TOD Action Guide, Center for Transit Oriented Development (CTOD) for Reconnecting America, the Center for Neighborhood Technology (www.reconnectingamerica.org); at http://reconnectingamerica.org/public/display_asset/090304mitodag0109.
CWW (2009), The Self-Sufficiency Standard, Center for Women’s Welfare (http://selfsufficiencystandard.org/standard.html). This defines the net income required to meet basic needs. It has been calculated for 37 states (http://selfsufficiencystandard.org/pubs.html).
DETR (2000), Social Exclusion and the Provision and Availability of Public Transport, Mobility and Inclusion Unit, Department of the Environment, Transport and the Regions, UK (www.mobility-unit.detr.gov.uk/socialex/index.htm).
Jago Dodson and Neil Sipe (2006), Shocking the Suburbs: Urban Location, Housing Debt and Oil Vulnerability in the Australian City, Research Paper 8, Urban Research Program, Griffith University (www98.griffith.edu.au); at www98.griffith.edu.au/dspace/bitstream/10072/12665/1/41353.pdf.
Environmental Justice Resource Center (www.ejrc.cau.edu) at Clark Atlanta University serves as a major resource center on environmental justice and transportation equity issues. Publishes quarterly Transportation Equity newsletter.
Yingling Fan and Arthur Huang (2011), How Affordable is Transportation? An Accessibility-Based Evaluation, CTS Report 11-12, Transitway Impacts Research Program, Center for Transportation Studies (www.cts.umn.edu); at www.cts.umn.edu/Publications/ResearchReports/reportdetail.html?id=2024.
FTA (2008), Better Coordination of Transportation and Housing Programs to Promote Affordable Housing Near Transit, Federal Transit Administration, USDOT and Department of Housing and Urban Development; at www.huduser.org/Publications/pdf/better_coordination.pdf.
Timothy Garceau, et al. (2013), “Evaluating Selected Costs Of Automobile-Oriented Transportation Systems From A Sustainability Perspective,” Research in Transportation Business & Management, Vol. 7, July 2013, pp. 43-53; www.sciencedirect.com/science/article/pii/S2210539513000059.
Edward L. Glaeser, Matthew E. Kahn and Jordan Rappaport (2000), Why Do the Poor Live in Cities? Discussion Paper Number 1891, Harvard Institute of Economic Research, (http://econweb.fas.harvard.edu); at http://econweb.fas.harvard.edu/hier/2000papers/HIER1891.pdf.
Peter M. Haas, Carrie Makarewicz, Albert Benedict, Thomas W. Sanchez and Casey J. Dawkins (2006), Housing & Transportation Cost Trade-offs and Burdens of Working Households in 28 Metros, Center for Neighborhood Technology (www.cnt.org); at www.cnt.org/repository/H-T-Tradeoffs-for-Working-Families-n-28-Metros-FULL.pdf.
Richard Haughey, et al. (2007), Ten Principles for Developing Affordable Housing, Urban Land Institute (www.uli.org).
Hexagon Transportation Consultants (2008), Results of Parking Demand Surveys for FCH Affordable Studio and Senior Housing Developments in San Jose, with Existing ECO-pass Programs for Tenants, First Community Housing, City of San Jose (www.sanjoseca.gov); at www.sanjoseca.gov/clerk/Agenda/20080812/20080812_1102att.pdf.
HUD (2008), “Parking Regulations and Housing Affordability,” Regulatory Barriers Clearinghouse, Volume 7, Issue 2, US Department of Housing and Urban Development, (www.huduser.org); at www.huduser.org/rbc/newsletter/vol7iss2more.html.
Ali A. Isalou, Todd Litman and Behzad Shahmoradi (2014), “Testing The Housing And Transportation Affordability Index In A Developing World Context: A Sustainability Comparison Of Central And Suburban Districts In Qom, Iran," Transport Policy, Vol. 33, May pp. 33-39; http://www.sciencedirect.com/science/article/pii/S0967070X14000377.
Wenya Jia and Martin Wachs (1998), Parking Requirements and Housing Affordability; A Case Study of San Francisco, Research Paper 380, University of California Transportation Center (www.uctc.net).
James Taylor Chair (2000), Status Quo Standards Versus An Alternative Standard, East Clayton Two Alternative Development Site Standards Compared, Technical Bulletin University of British Columbia, Landscape Architecture (www.sustainable-communities.agsci.ubc.ca/bulletins/TB_issue_02_ADSedit.pdf).
Jobs Access Project (http://povertycenter.cwru.edu) is a multi-faceted project by the Center on Urban Poverty and Social Change at Case Western Reserve University intended to enhance understanding of the relationship between job access (including transportation) and successful welfare-to-work transitions.
David S. Johnson, John M. Rogers and Lucilla Tan (2001), “A Century Of Family Budgets In The United States,” Monthly Labor Review (www.bls.gov/opub/mlr/2001/05/art3full.pdf), May 2001, pp. 28-46.
Neil Kleiman, Matt Pacenza and Amy Westervelt (2009), Green Cities: How Urban Sustainability Efforts Can and Must Drive America’s Climate Change Policies, Living Cities (www.livingcities.org); at www.livingcities.org/GreenCitiesReport.pdf.
Marc Lee, Erick Villagomez, Penny Gurstein, David Eby and Elvin Wyly (2008), Affordable EcoDensity: Making Affordable Housing a Core Principle of Vancouver’s EcoDensity Charter, Canadian Center for Policy Alternatives (www.policyalternatives.ca); at www.policyalternatives.ca/documents/BC_Office_Pubs/bc_2008/affordable_ecodensity.pdf.
Barbara Lipman (2005), “Something’s Gotta Give: Working Families and the Cost of Housing,” New Century Housing, Volume 5, Issue 2, Center for Housing Policy; at www.nhc.org/pdf/pub_nc_sgg_04_05.pdf.
Barbara Lipman (2006), A Heavy Load: The Combined Housing and Transportation Burdens of Working Families, Center for Housing Policy (www.nhc.org/pdf/pub_heavy_load_10_06.pdf).
Todd Litman (2003), Parking Requirement Impacts on Housing Affordability, VTPI (www.vtpi.org); at www.vtpi.org/park-hou.pdf.
Todd Litman (2004a), Pay-As-You-Drive Pricing For Insurance Affordability, VTPI (www.vtpi.org); at www.vtpi.org/payd_aff.pdf.
Todd Litman (2004b), Evaluating Public Transit Benefits and Costs, VTPI (www.vtpi.org); at www.vtpi.org/tranben.pdf.
Todd Litman (2005), Understanding Smart Growth Saving, VTPI (www.vtpi.org); at www.vtpi.org/sg_save.pdf.
Todd Litman (2006), Smart Growth Reforms, VTPI (www.vtpi.org); at www.vtpi.org/smart_growth_reforms.pdf.
Todd Litman (2007), Transportation Affordability: Evaluation and Improvement Strategies, VTPI (www.vtpi.org); at www.vtpi.org/affordability.pdf.
Todd Litman (2008), Recommendations for Improving LEED Transportation and Parking Credits, VTPI (www.vtpi.org); at www.vtpi.org/leed_rec.pdf.
Todd Litman (2008), Evaluating Accessibility for Transportation Planning, Victoria Transport Policy Institute (www.vtpi.org); at www.vtpi.org/access.pdf .
Todd Litman (2009), Where We Want To Be: Home Location Preferences And Their Implications For Smart Growth, Victoria Transport Policy Institute (www.vtpi.org); at www.vtpi.org/sgcp.pdf.
Todd Litman (2009), Memo From Future Self: Hope For The Best But Prepare For the Worst, Planetizen (www.planetizen.com/node/39418).
Todd Litman (2010), Raise My Taxes, Please! Evaluating Household Savings From High Quality Public Transit Service, VTPI (www.vtpi.org); at www.vtpi.org/raisetaxes.pdf.
Todd Litman (2015), Affordable-Accessible Housing In A Dynamic City: Why and How To Support Development of More Affordable Housing In Accessible Locations, Victoria Transport Policy Institute (www.vtpi.org); at www.vtpi.org/aff_acc_hou.pdf. Also see the Affordable-Accessible Housing Photo Essay, at www.vtpi.org/aff_acc_photo.pdf.
William Lucy and David L. Phillips (2006), Tomorrow’s Cities, Tomorrow’s Suburbs, Planners Press (www.planning.org).
Barbara McCann (2000), Driven to Spend; The Impact of Sprawl on Household Transportation Expenses, STPP (www.transact.org).
Simon McDonnell, Josiah Madar and Vicki Been (2011), “Minimum Parking Requirements And Housing Affordability in New York City,” Housing Policy Debate, Vol. 21, No. 1, January, pp. 45 – 68 (www.informaworld.com/smpp/content~content=a931285978~frm=abslink); based on A Continuing Role for Minimum Parking Requirements in a Dense Growing City?, Furman Center for Real Estate and Urban Policy; at http://lsr.nellco.org/cgi/viewcontent.cgi?article=1218&context=nyu_lewp.
Metro Vancouver (2012), Metro Vancouver Apartment Parking Study; Revised Technical Report, Metropolitan Planning, Environment, and Parks (www.metrovancouver.org); at www.metrovancouver.org/planning/development/strategy/Pages/Implementation.aspx. Also see, “Apartment parking spots lift development costs in Vancouver,” Georgia Strait, www.straight.com/article-770756/vancouver/parking-spots-lift-prices.
Metro Vancouver (2012), What Works: Affordable Housing Initiatives in Metro Vancouver Municipalities, Metro Vancouver Regional Housing (www.metrovancouver.org); at www.metrovancouver.org/planning/development/housingdiversity/Pages/default.aspx.
Eric Miller (2004), Travel and Housing Costs in the Greater Toronto Area: 1986-1996, Neptis Foundation (www.neptis.org).
Mixed-Income Transit-Oriented Development Action Guide (www.mitod.org), developed by the Center for Transit-Oriented Development, is a comprehensive website providing information on ways to create mixed-income housing in transit-oriented development, in order to create more affordable-accessible housing.
MWCOG (2005), Toolkit for Affordable Housing Development, Metropolitan Washington Council of Governments (www.mwcog.org), Publication Number: 20058254; at www.mwcog.org/uploads/pub-documents/9VpbXg20060217144716.pdf.
Arthur C. Nelson, Rolf Pendall, Casy Dawkins and Gerrit Knaap (2002), The Link Between Growth Management and Housing Affordability: The Academic Evidence, Brookings Institution Center on Urban and Metropolitan Policy (www.brook.edu); at www.brook.edu/dybdocroot/es/urban/publications/growthmang.pdf.
NPH (2003), Community Acceptance Toolkit (www.nonprofithousing.org/pages/housing-policy-and-advocacy/toolkits_community_acceptance.html), by the Non-Profit Housing Association of Northern California provides information on residential parking regulations, costs and management strategies to improve efficiency and increase housing affordability, including, Contemporary Affordable Housing: What Is The Impact Of Parking (www.nonprofithousing.org/pdf_toolkits/Parking-2-26.pdf) and Myths and Facts About Parking Planning (www.nonprofithousing.org/pdf_toolkits/mythsandfacts.pdf).
QuantEcon (2002), Smart Growth and Its Effects on Housing Markets: The New Segregation, National Center for Public Policy Research (www.nationalcenter.org).
Dan Parolek (2012), Missing Middle Housing: Responding To Demand For Urban Living, Better Towns and Cities (http://bettercities.net); at http://bettercities.net/news-opinion/blogs/dan-parolek/17698/missing-middle-housing-responding-demand-urban-living.
Gary Pivo (2013), The Effect Of Transportation, Location, And Affordability Related Sustainability Features On Mortgage Default Prediction And Risk In Multifamily Rental Housing, University of Arizona for Fannie Mae (www.fanniemae.com); at www.fanniemae.com/resources/file/aboutus/pdf/hoytpivo_mfhousing_sustainability.pdf. Also see, Walk Score and Multifamily Default: The Significance of 8 and 80, Fannie Mae (www.fanniemae.com); at www.fanniemae.com/resources/file/fundmarket/pdf/hoytpivo_mfhousing_walkscore_122013.pdf.
Stephanie Pollack, Barry Bluestone and Chase Billingham (2010), Maintaining Diversity In America’s Transit-Rich Neighborhoods: Tools for Equitable Neighborhood Change, Dukakis Center for Urban and Regional Policy (www.dukakiscenter.org); at www.dukakiscenter.org/storage/TRNEquityFull.pdf.
Reconnecting America and CTOD (2007), Realizing the Potential: Expanding Housing Opportunities Near Transit, Reconnecting America (www.reconnectingamerica.org) for the Federal Transit Administration and the U.S. Department of Housing and Urban Development.
Lorien Rice (2004), Transportation Spending by Low-Income California Households: Lessons for the San Francisco Bay Area, Public Policy Institute of California (www.ppic.org/content/pubs/R_704LRR.pdf).
Ryan Russo (2001), Planning for Residential Parking: A Guide For Housing Developers and Planners, Non-Profit Housing Association of Northern California (www.nonprofithousing.org) and the Berkeley Program on Housing and Urban Policy (http://urbanpolicy.berkeley.edu).
SFU (2006), Affordability by Design: Affordability for All, City Program, Simon Fraser University (www.sfu.ca/city/city_pgm_pubs.htm).
SPUR (1998), Reducing Housing Costs by Rethinking Parking Requirements, The San Francisco Planning and Urban Research Association (www.spur.org).
STPP (2003), Transportation Costs and the American Dream: Why a Lack of Transportation Choices Strains the Family Budget and Hinders Home Ownership, Surface Transportation Policy Project (www.transact.org).
Ray Tomalty and Murtaza Haider (2008), Housing Affordability and Smart Growth in Calgary, Plan-It Calgary, City of Calgary (www.calgary.ca); at www.calgary.ca/docgallery/BU/planning/pdf/plan_it/housing_afford_and_smarth_growth_report.pdf.
Tompkins County (2009), Promote Choice And Affordability In Housing Options; Vital Communities Toolbox, Tompkins County (www.co.tompkins.ny.us); at www.co.tompkins.ny.us/planning/vct/3.html.
TransForm (2009), Windfall For All: How Connected, Convenient Neighborhoods Can Protect Our Climate and Safeguard California’s Economy, TransForm (www.TransFormCA.org); at www.transformca.org/windfall-for-all.
Travel Time and Housing Price Maps (www.mysociety.org/2007/more-travel-maps/morehousing). This interactive mapping system shows both travel times to the city center and housing costs for various locations in London.
ULI (2009), Beltway Burden: The Combined Cost of Housing and Transportation in the Greater Washington, DC Metropolitan Area, ULI Terwilliger Center for Workforce Housing, Urban Land Institute (www.uli.org); at http://commerce.uli.org/misc/BeltwayBurden.pdf).
ULI (2009), Bay Area Burden: Examining the Impacts and Hidden Costs of Housing and Transportation on Bay Area Residents, Their Neighborhoods, and the Environment, ULI Terwilliger Center for Workforce Housing (www.uli.org); at http://bayareaburden.org/wp-content/uploads/2009/11/Bay-Area-Burden_FINAL_lowres.pdf. Also provides a Cost Calculator which estimates the typical costs of housing and transportation for various locations within the San Francisco Bay Area.
Urban Accessibility Explorer (http://urbanaccessibility.com) is an easy-to-use mapping system that measures the number of activities, including various types of jobs, schools, parks, stores and libraries, that can be reached by residents of a specified neighborhood within a given amount of travel time, by a particular mode and time of day in the Chicago Metropolitan area.
Urban Land Institute (www.uli.org) is a professional organization for developers that provides a variety of resources for affordable housing planning and development, including reports such as Ten Principles for Developing Affordable Housing and Best Practices in the Production of Affordable Housing.
USGBC Affordable Housing Initiative (www.usgbc.org/DisplayPage.aspx?CMSPageID=2031), US Green Building Council. Provides guidelines for creating more energy efficient affordable housing.
Vancouver EcoDensity (www.vancouver-ecodensity.ca) is an integrated program to increase urban livability, affordability and environmental performance through policy and planning reforms that encourage more compact, mixed, infill development.
Robert W. Wassmer and Michelle C. Baass (2005), Does a More Centralized Urban Form Raise Housing Prices, APPAM “Suburbanization and its Discontents” conference; Journal of Policy Analysis and Management; California State University Sacramento (http://onlinelibrary.wiley.com/doi/10.1002/pam.20180/abstract).
This Encyclopedia is produced by the Victoria Transport Policy Institute to help improve understanding of Transportation Demand Management. It is an ongoing project. Please send us your comments and suggestions for improvement.
Victoria Transport Policy Institute
www.vtpi.org info@vtpi.org
1250 Rudlin Street, Victoria, BC, V8V 3R7, CANADA
Phone & Fax 250-360-1560
#106